charts & graphs
graphical representation of a variable or a set of information
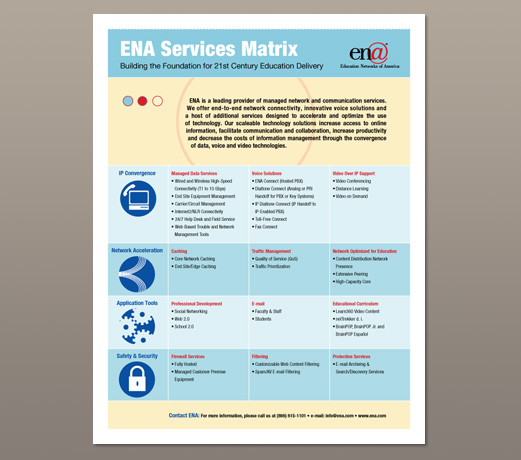
Project Name: ENA Service Matrix Handout
Client: Education Networks of America (ENA)
Project Description: Graphical illustration of the company's service offerings on a single-page print and online publication.
Project Role:
Layout a set of information within a grid using the corporate design guidelines and some existing icons.
Software used: Adobe Illustrator
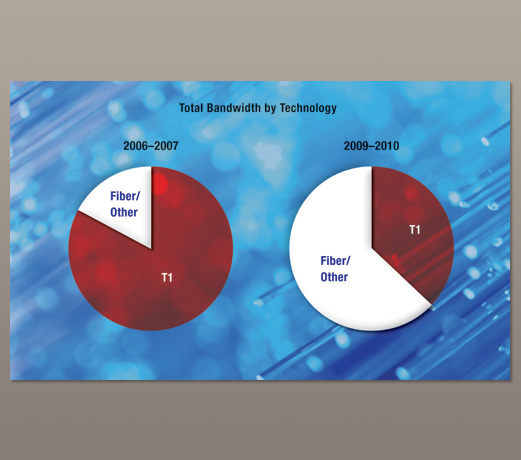
Project Name: Total Bandwidth by Technology Chart
Client: Education Networks of America (ENA)
Project Description: Graphical represntation of increasing demand for broadband via fiber optic technology within the past few years.
Project Role:
Illustrate the change in data using an image background for higher visual impact.
Software used: Adobe Illustrator and Photoshop
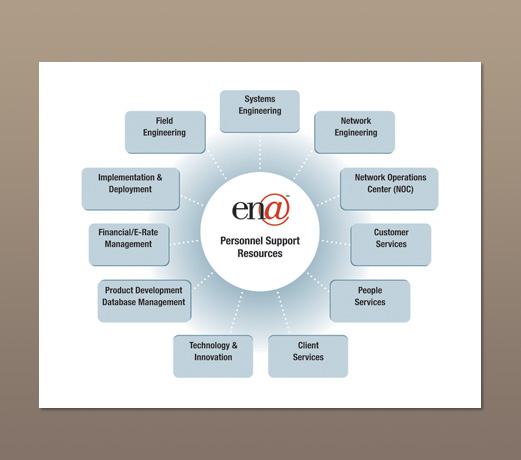
Project Name: Corporate Personnel Chart
Client: Education Networks of America (ENA)
Project Description: Graphical template of corporate personnel.
Project Role:
Arrange a cluster of information to be used as a template with regular revisions of the number of staff in a department.
Software used: Adobe Illustrator
contact info:
Jojo Soriano
SEEDesign & Illustration
T (510) 245-8500 :: F (510) 722-2020 :: e-mail: jojos@seedesign.com
Web: www.seedesign.com |